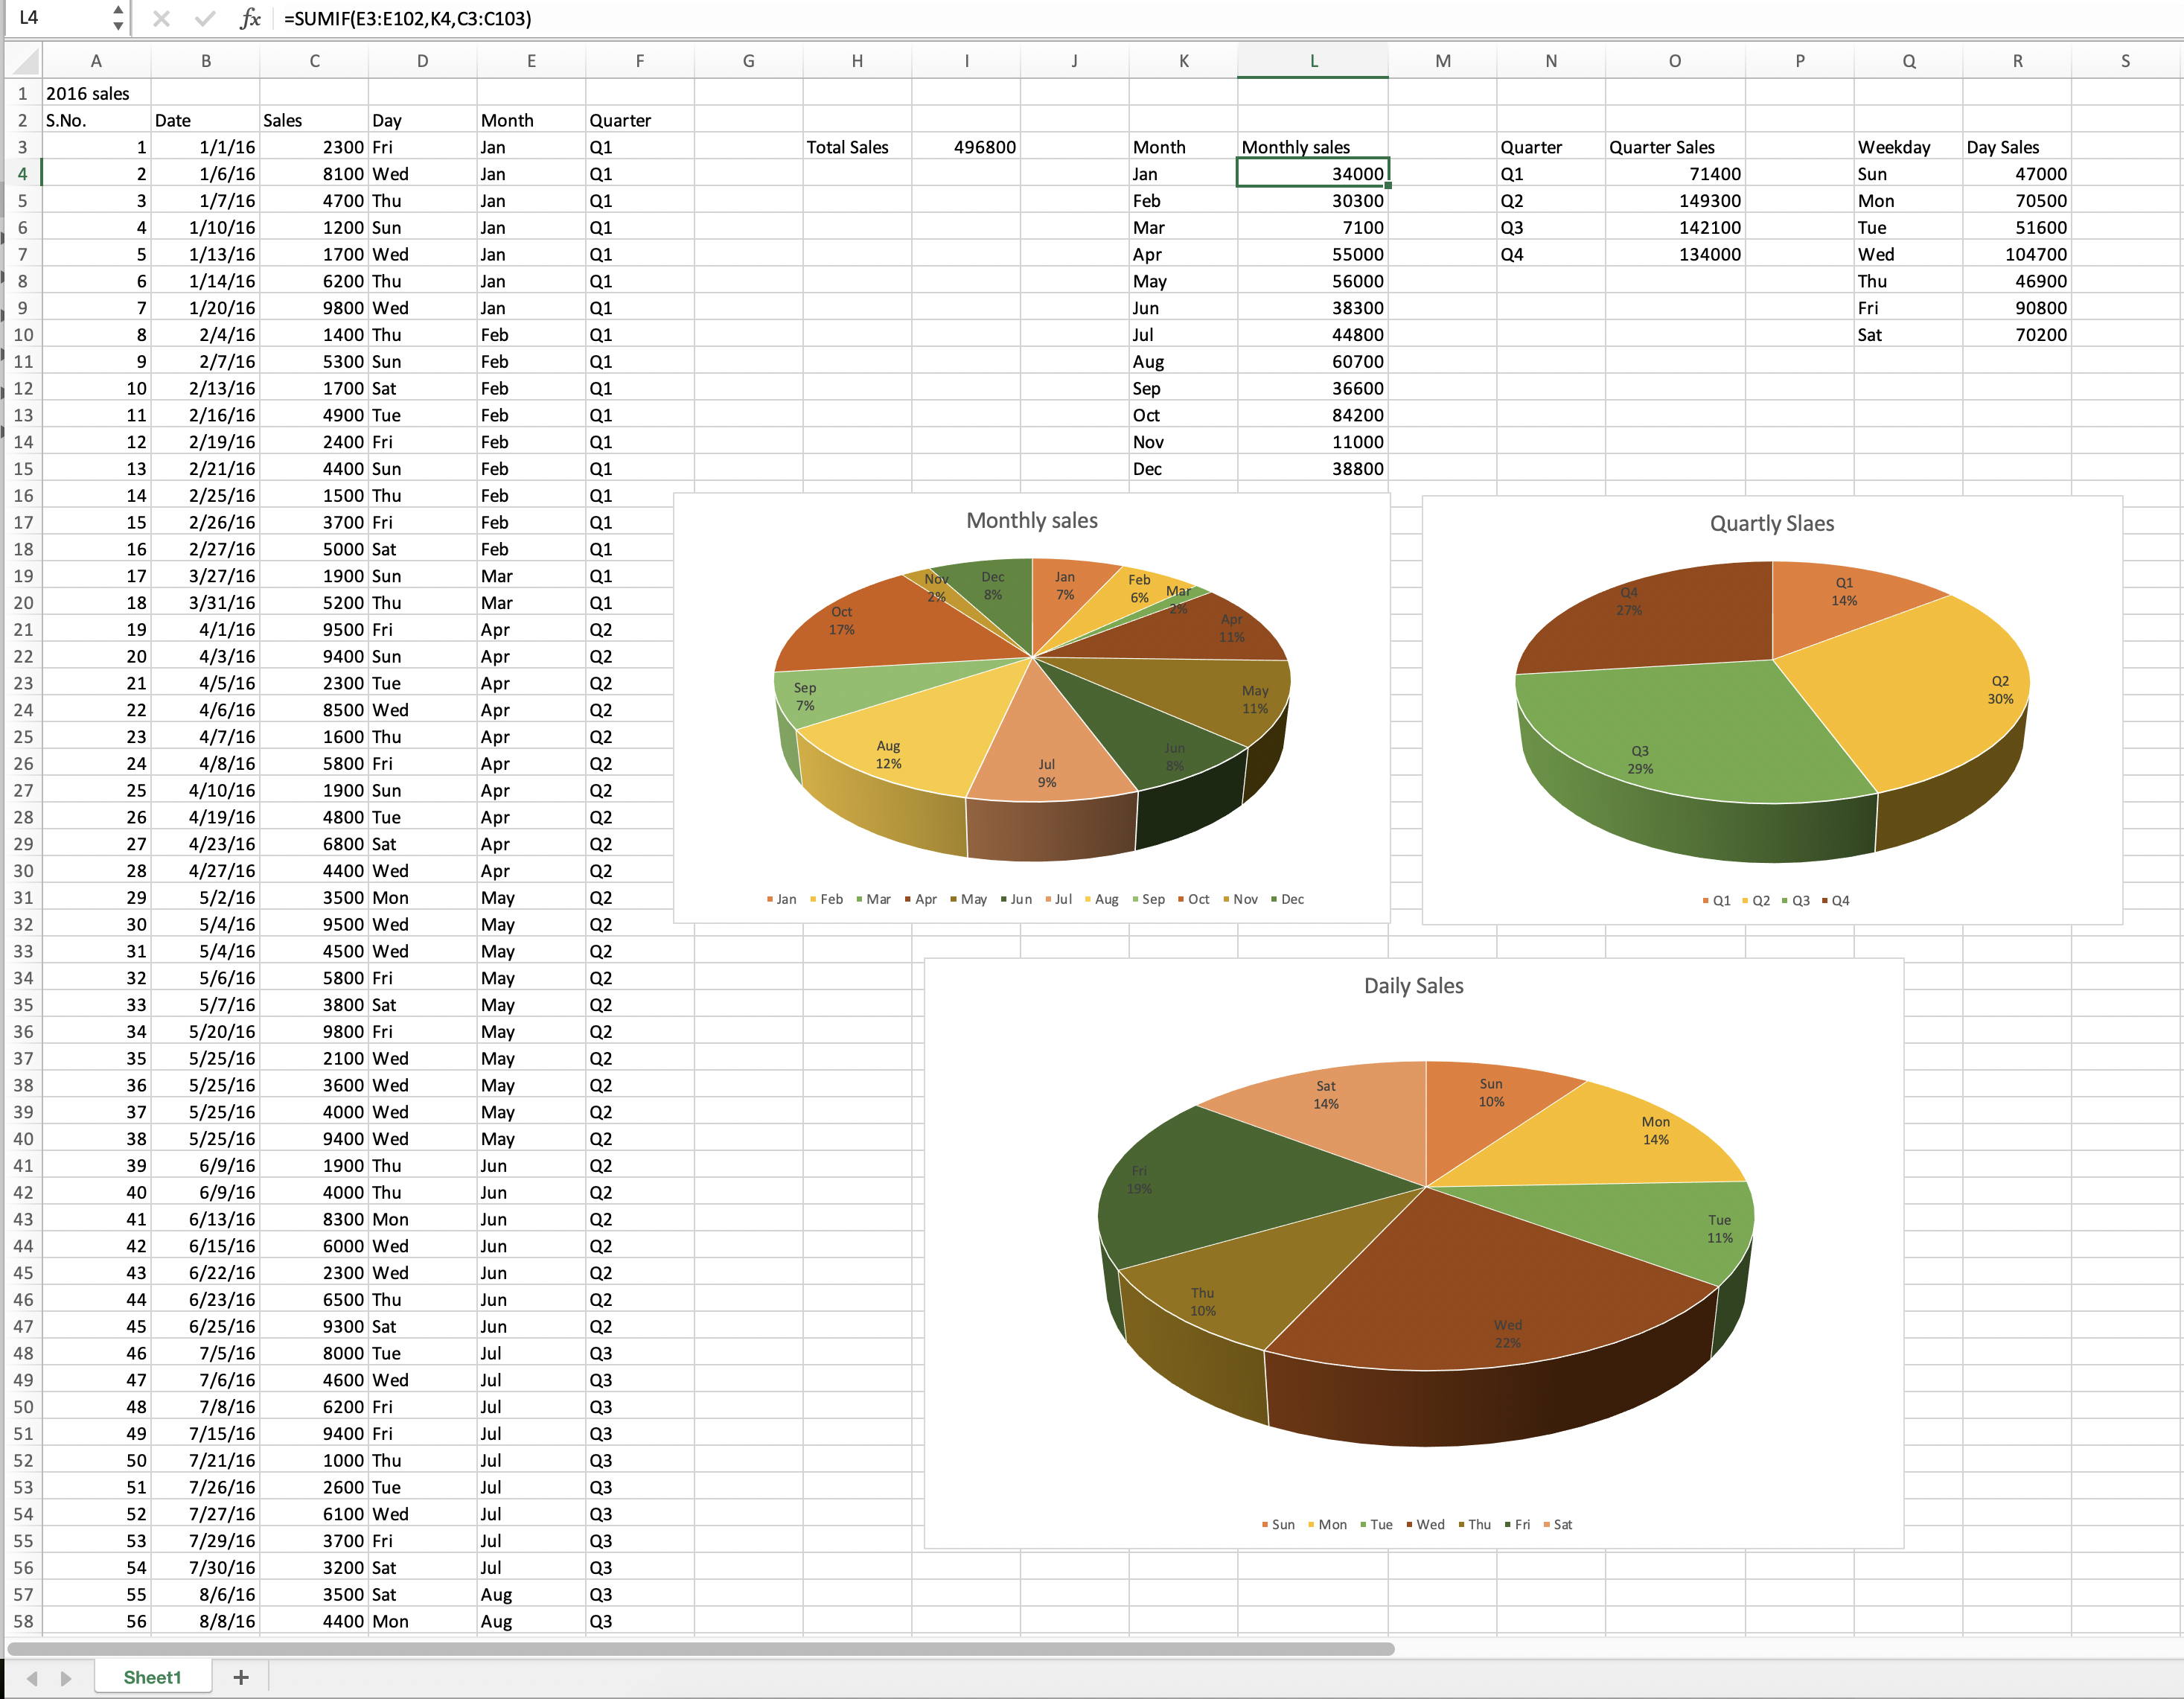
Raw Sales Data transformed into an Interactive Dashboard using Excel and Pivot Tables
Simple sales aggregation into pie charts
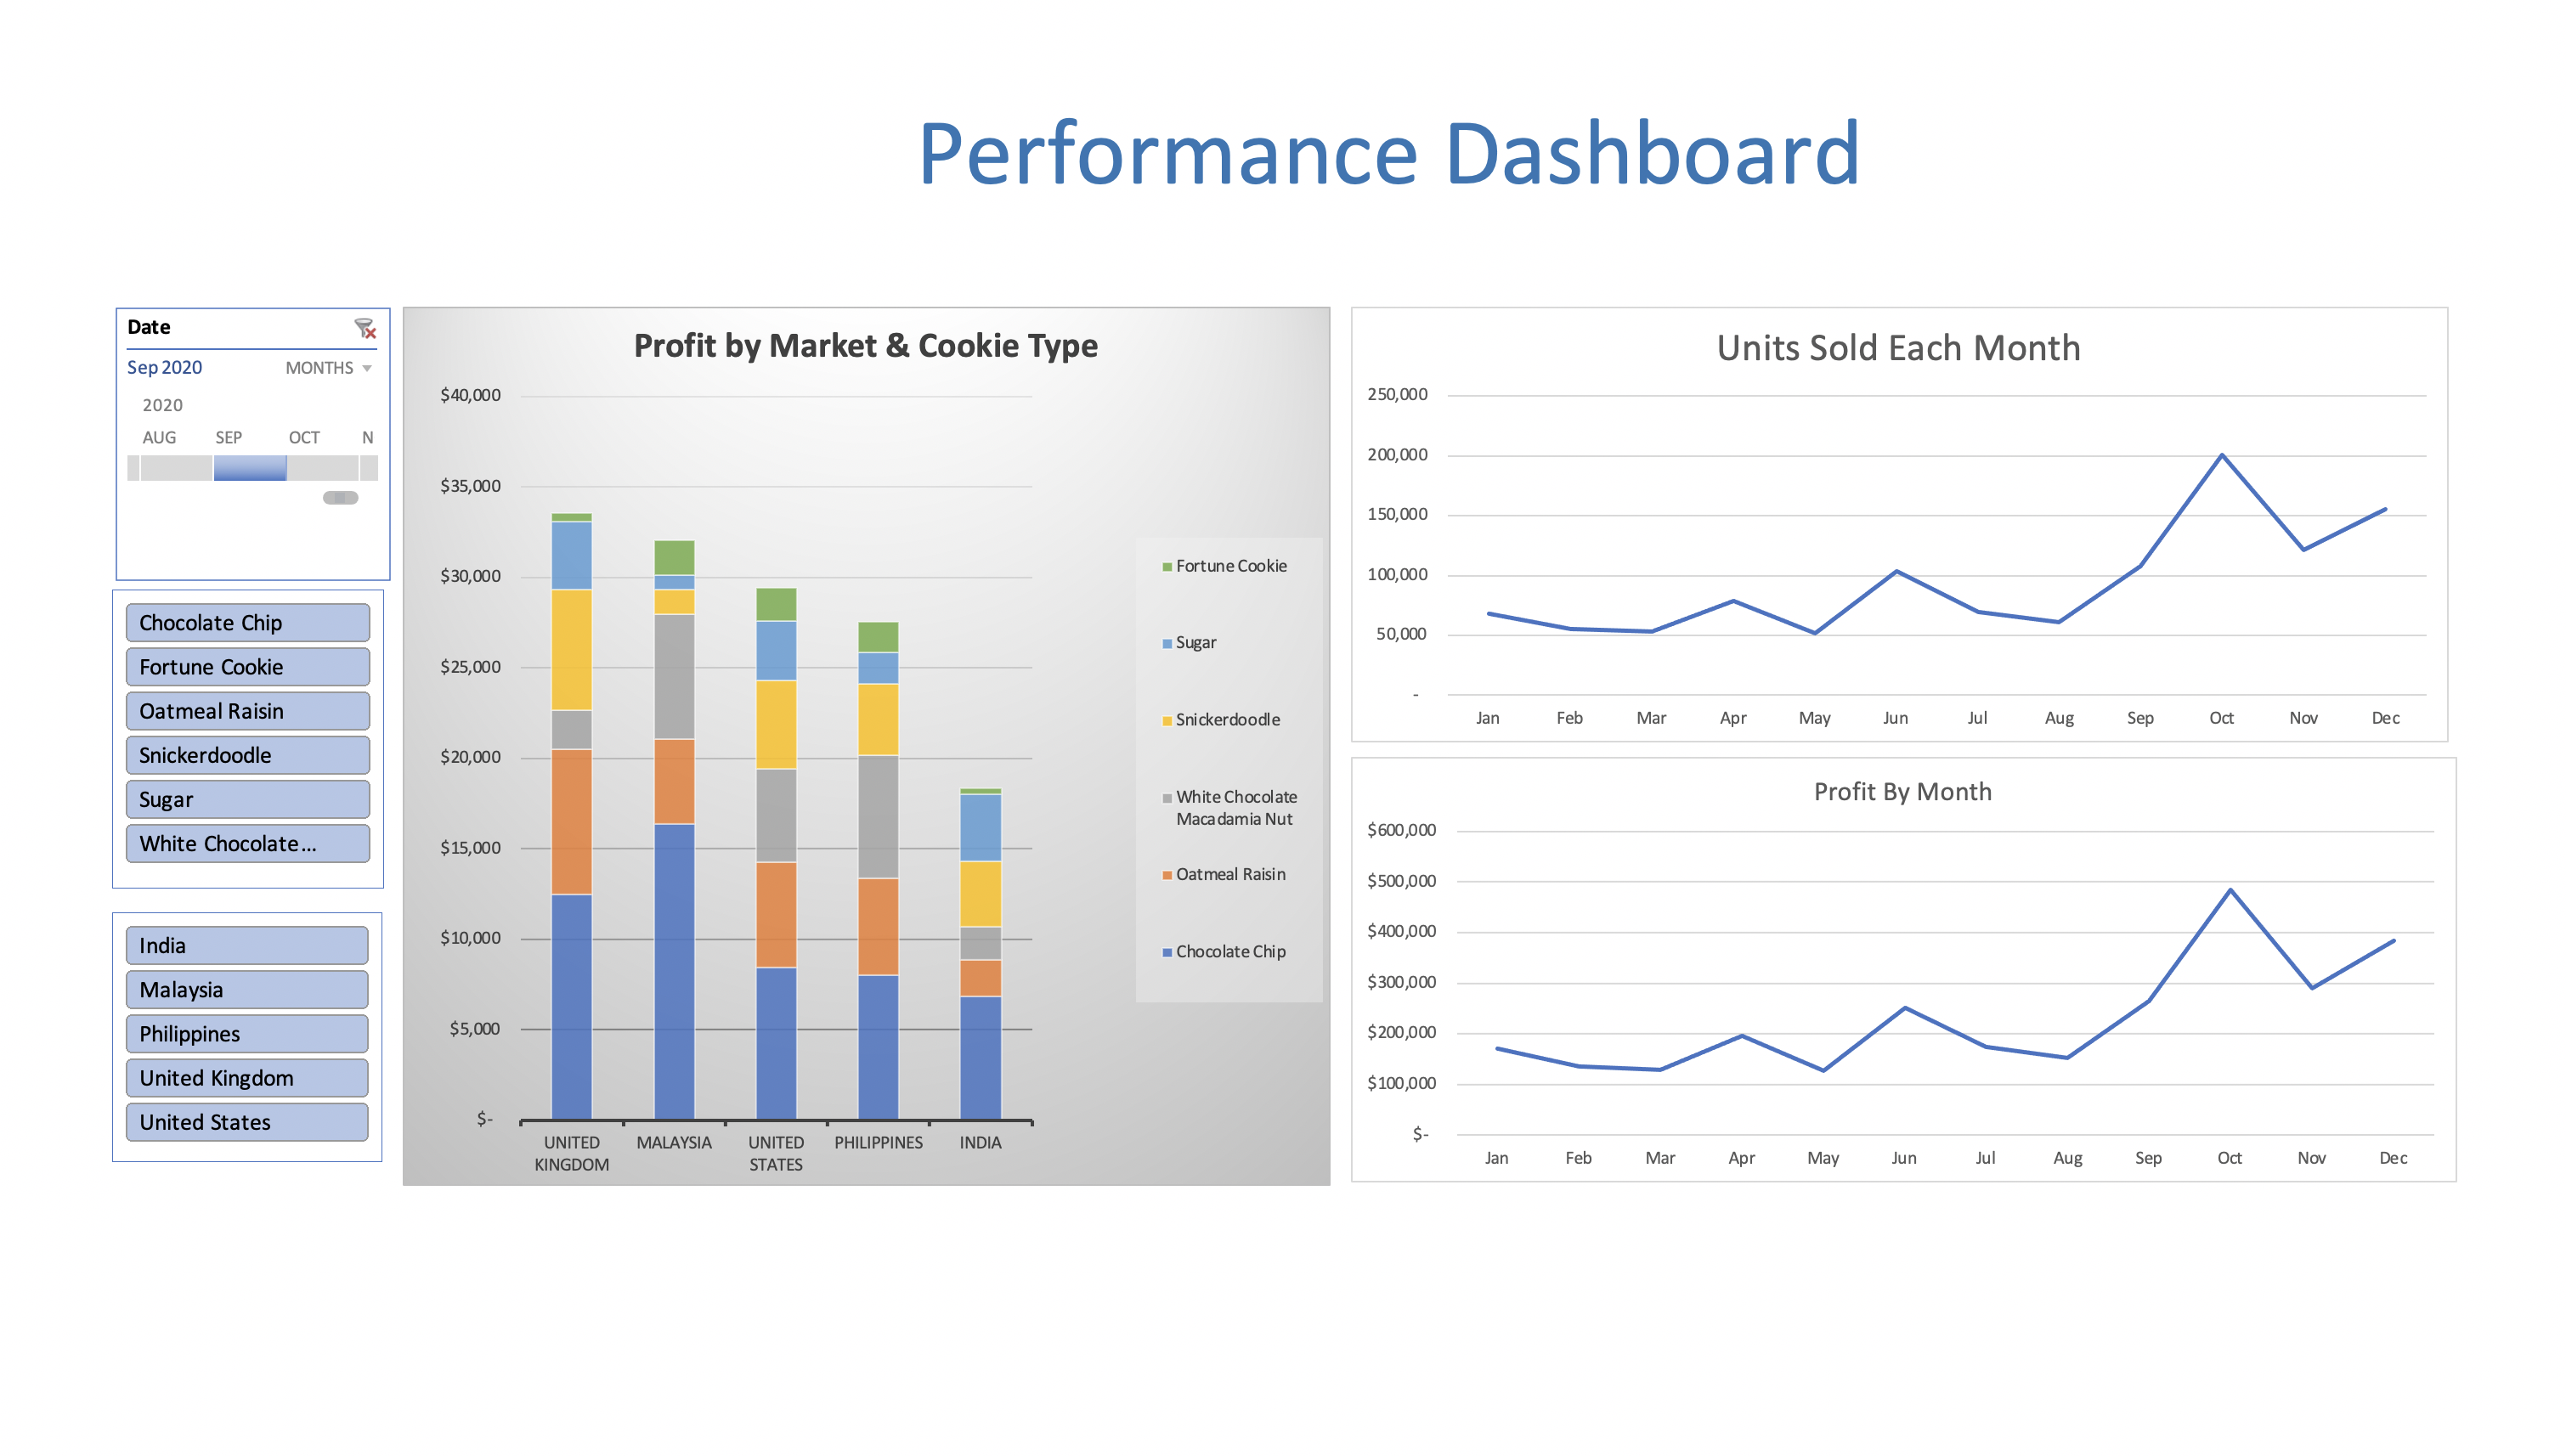
Interactive "Profit and Sales" Dashboard that Auto updates to newest data
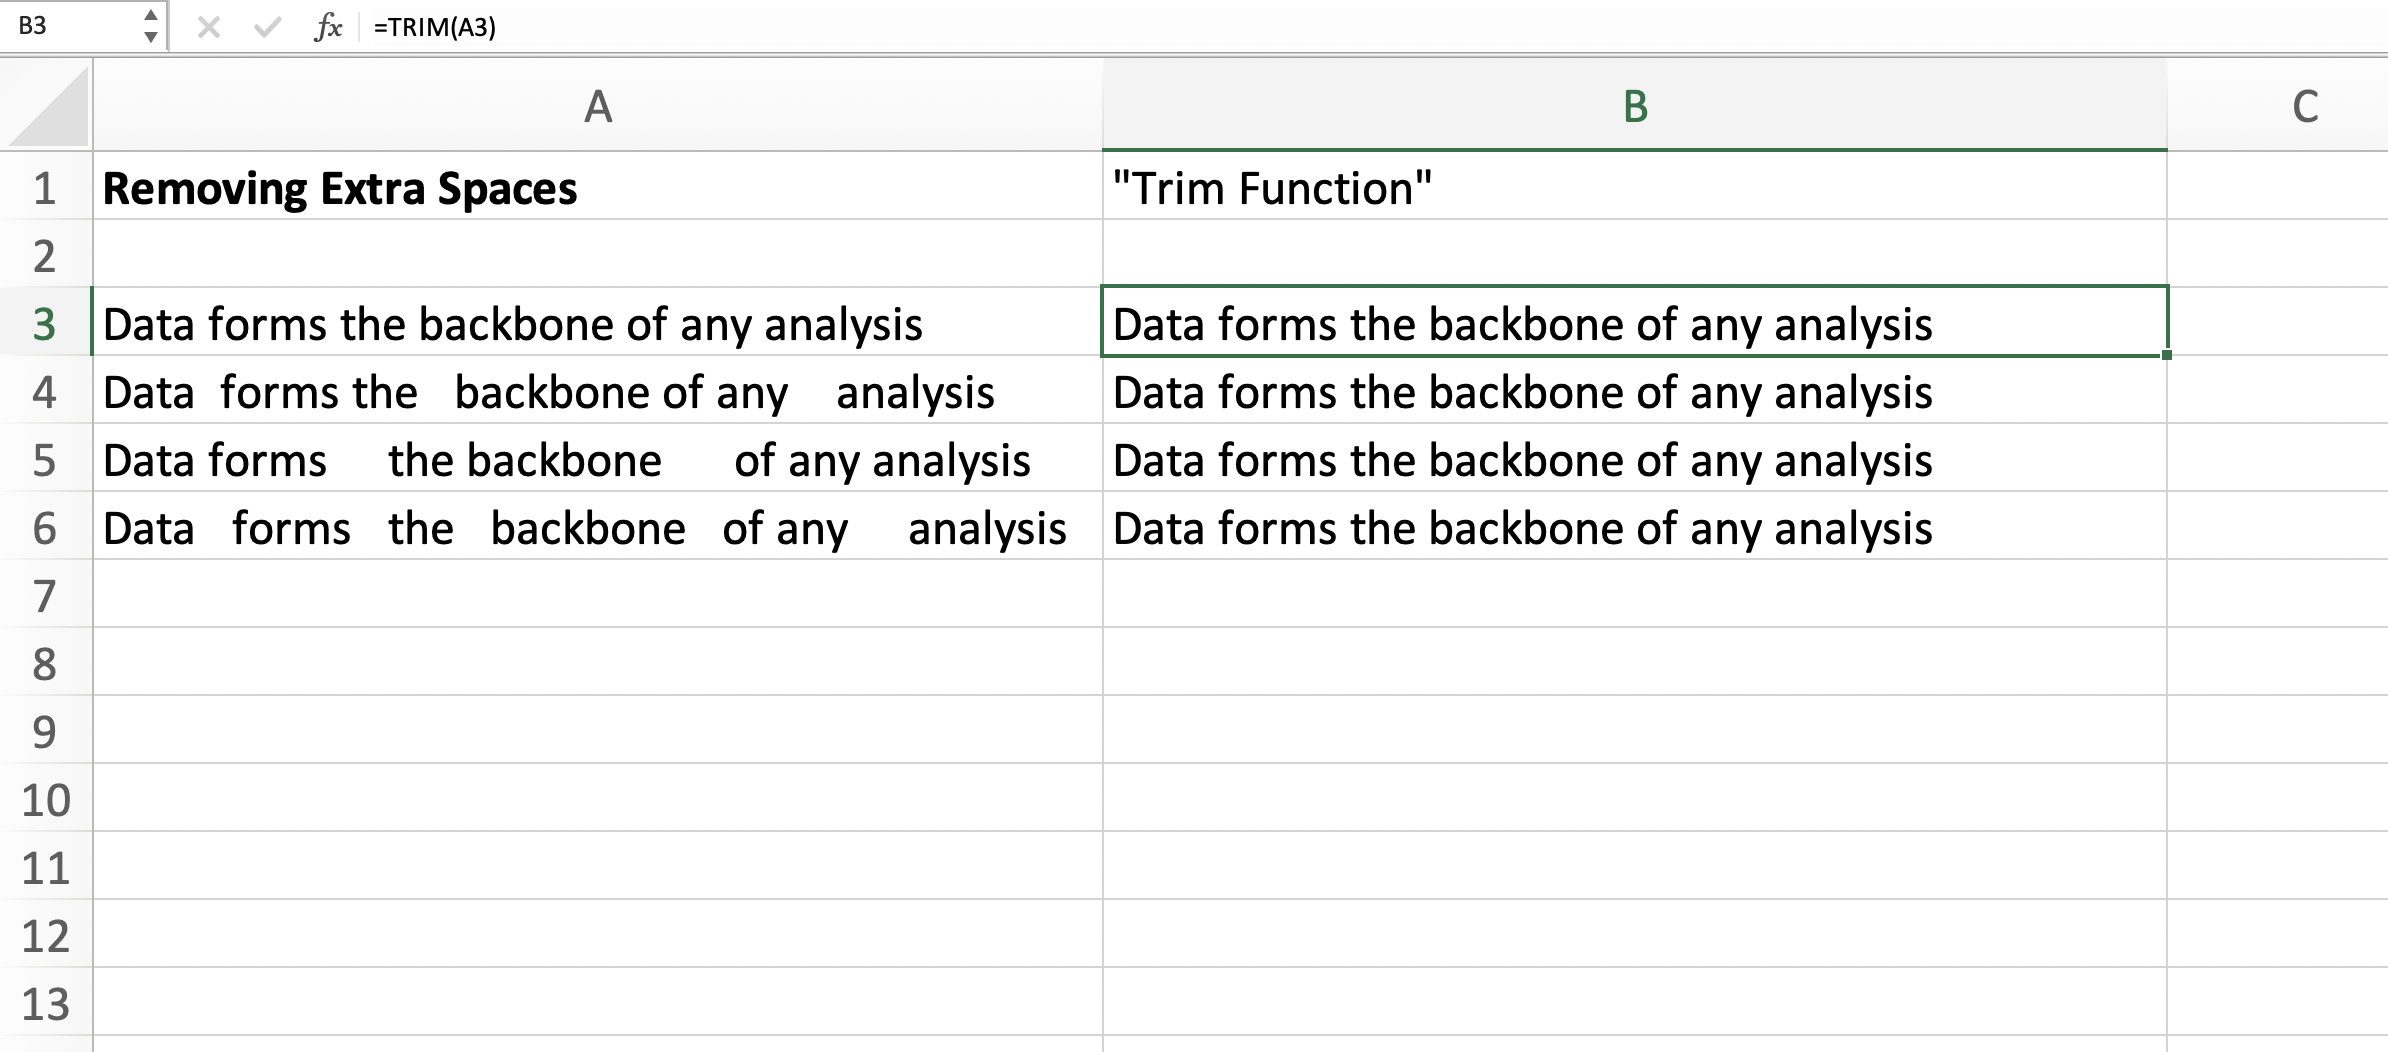
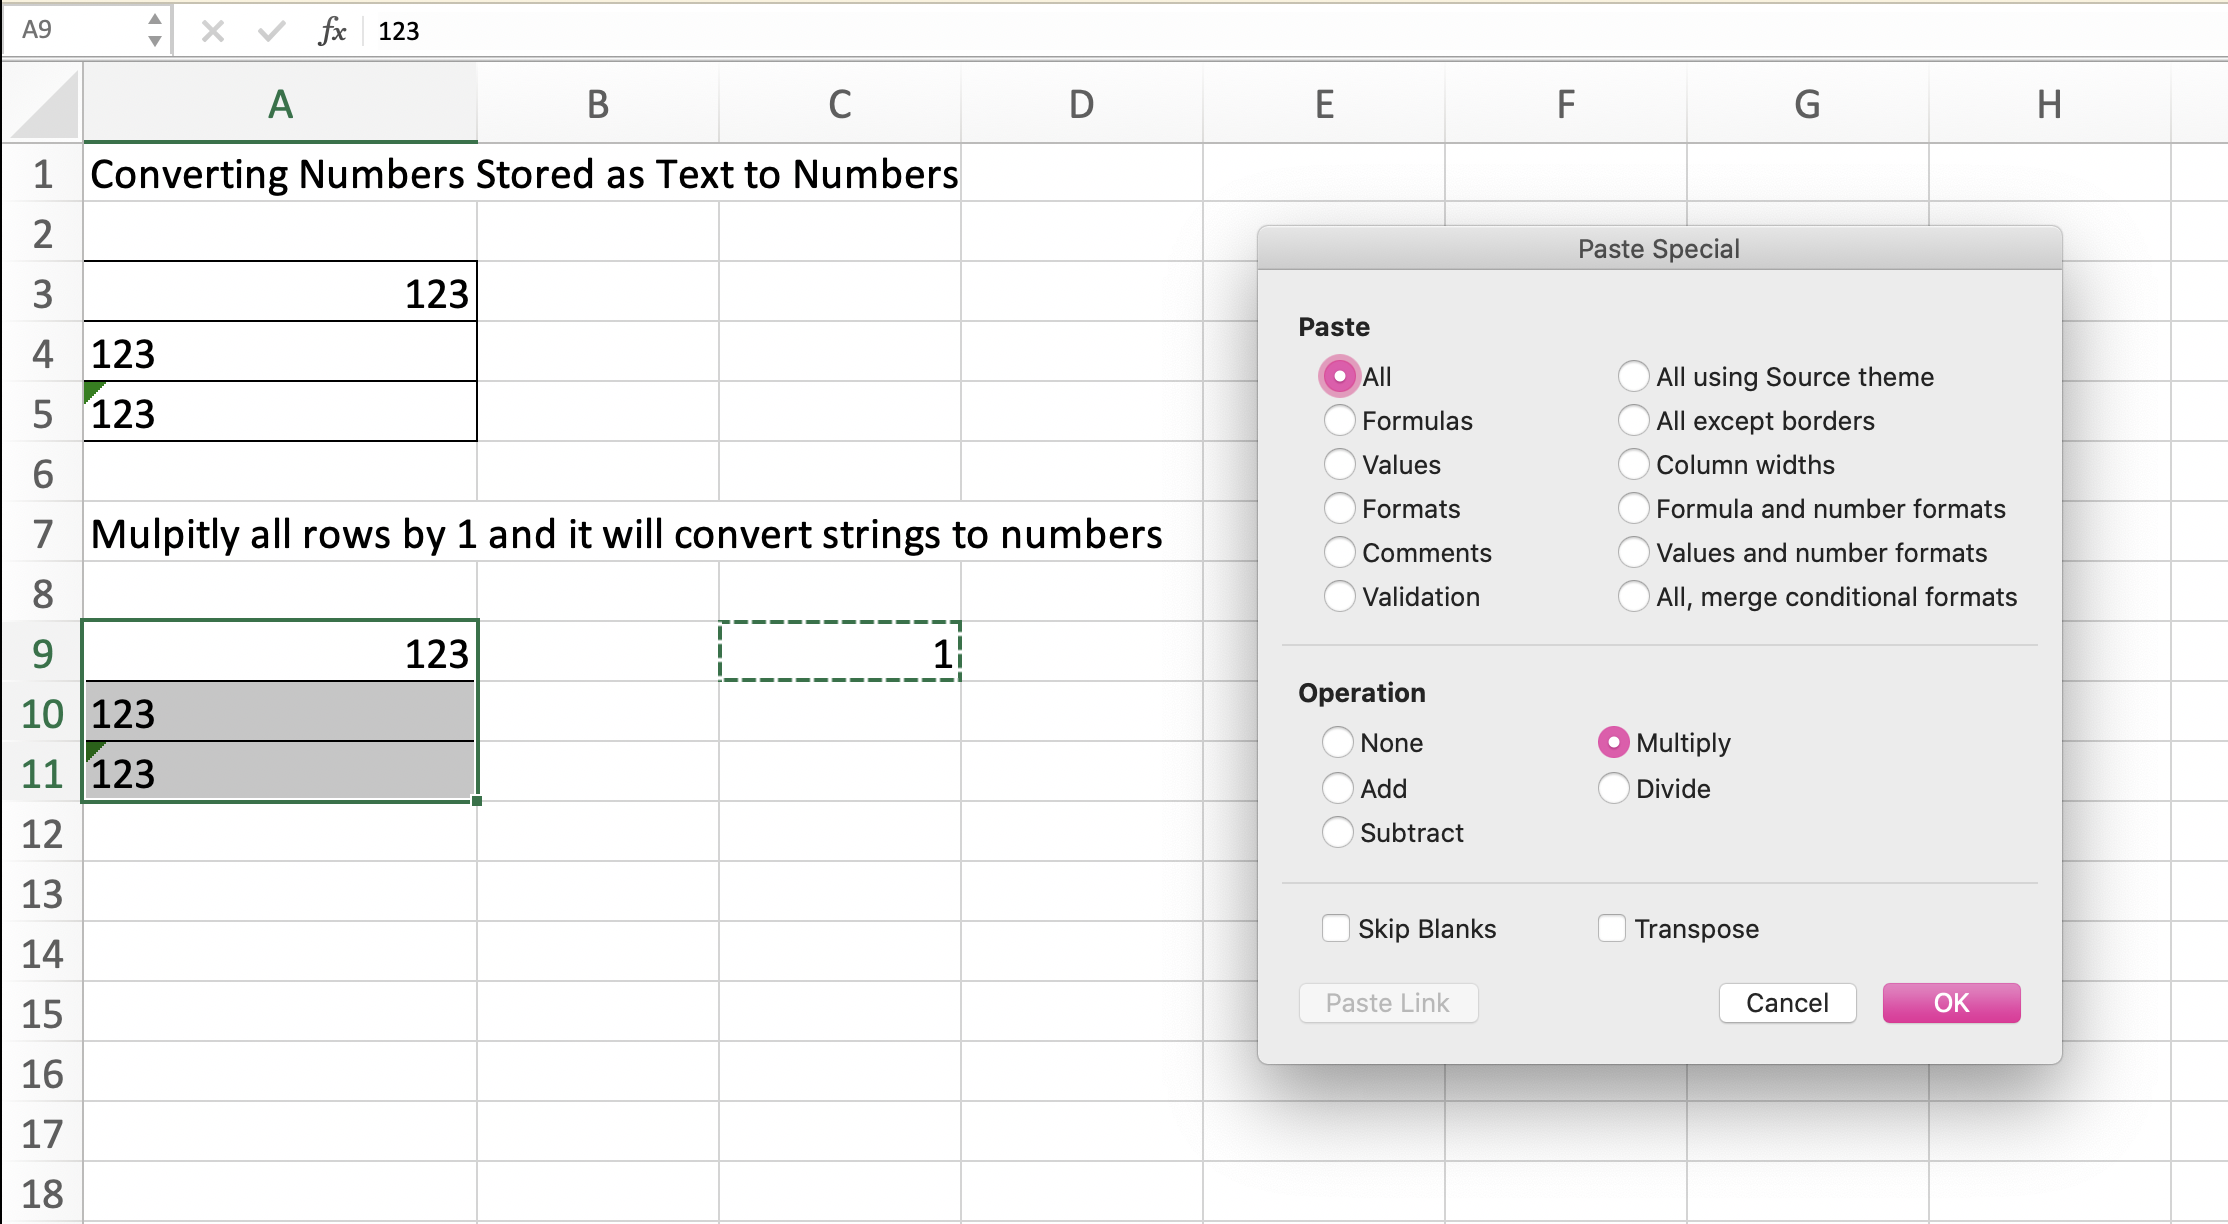
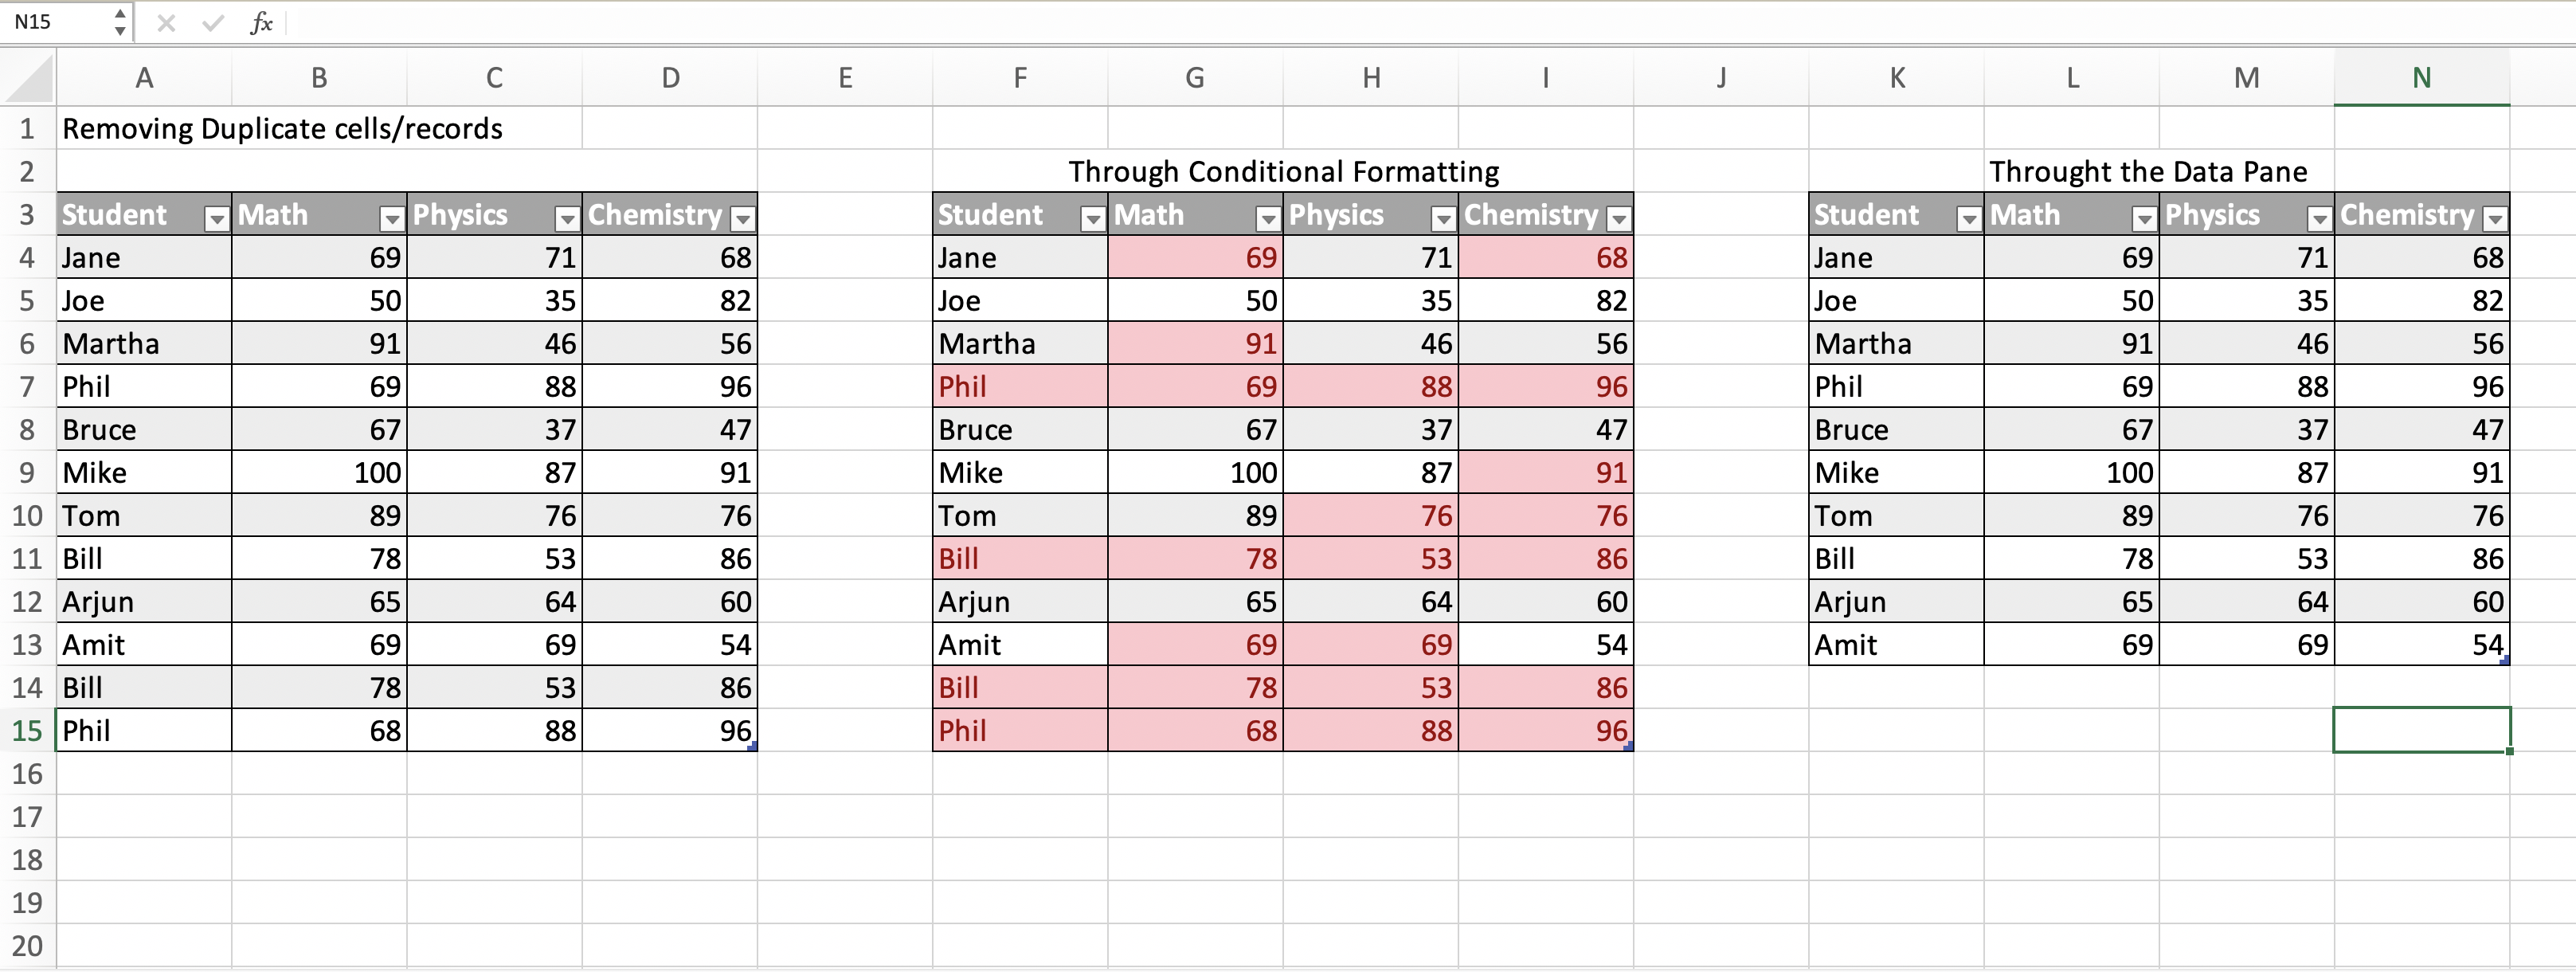
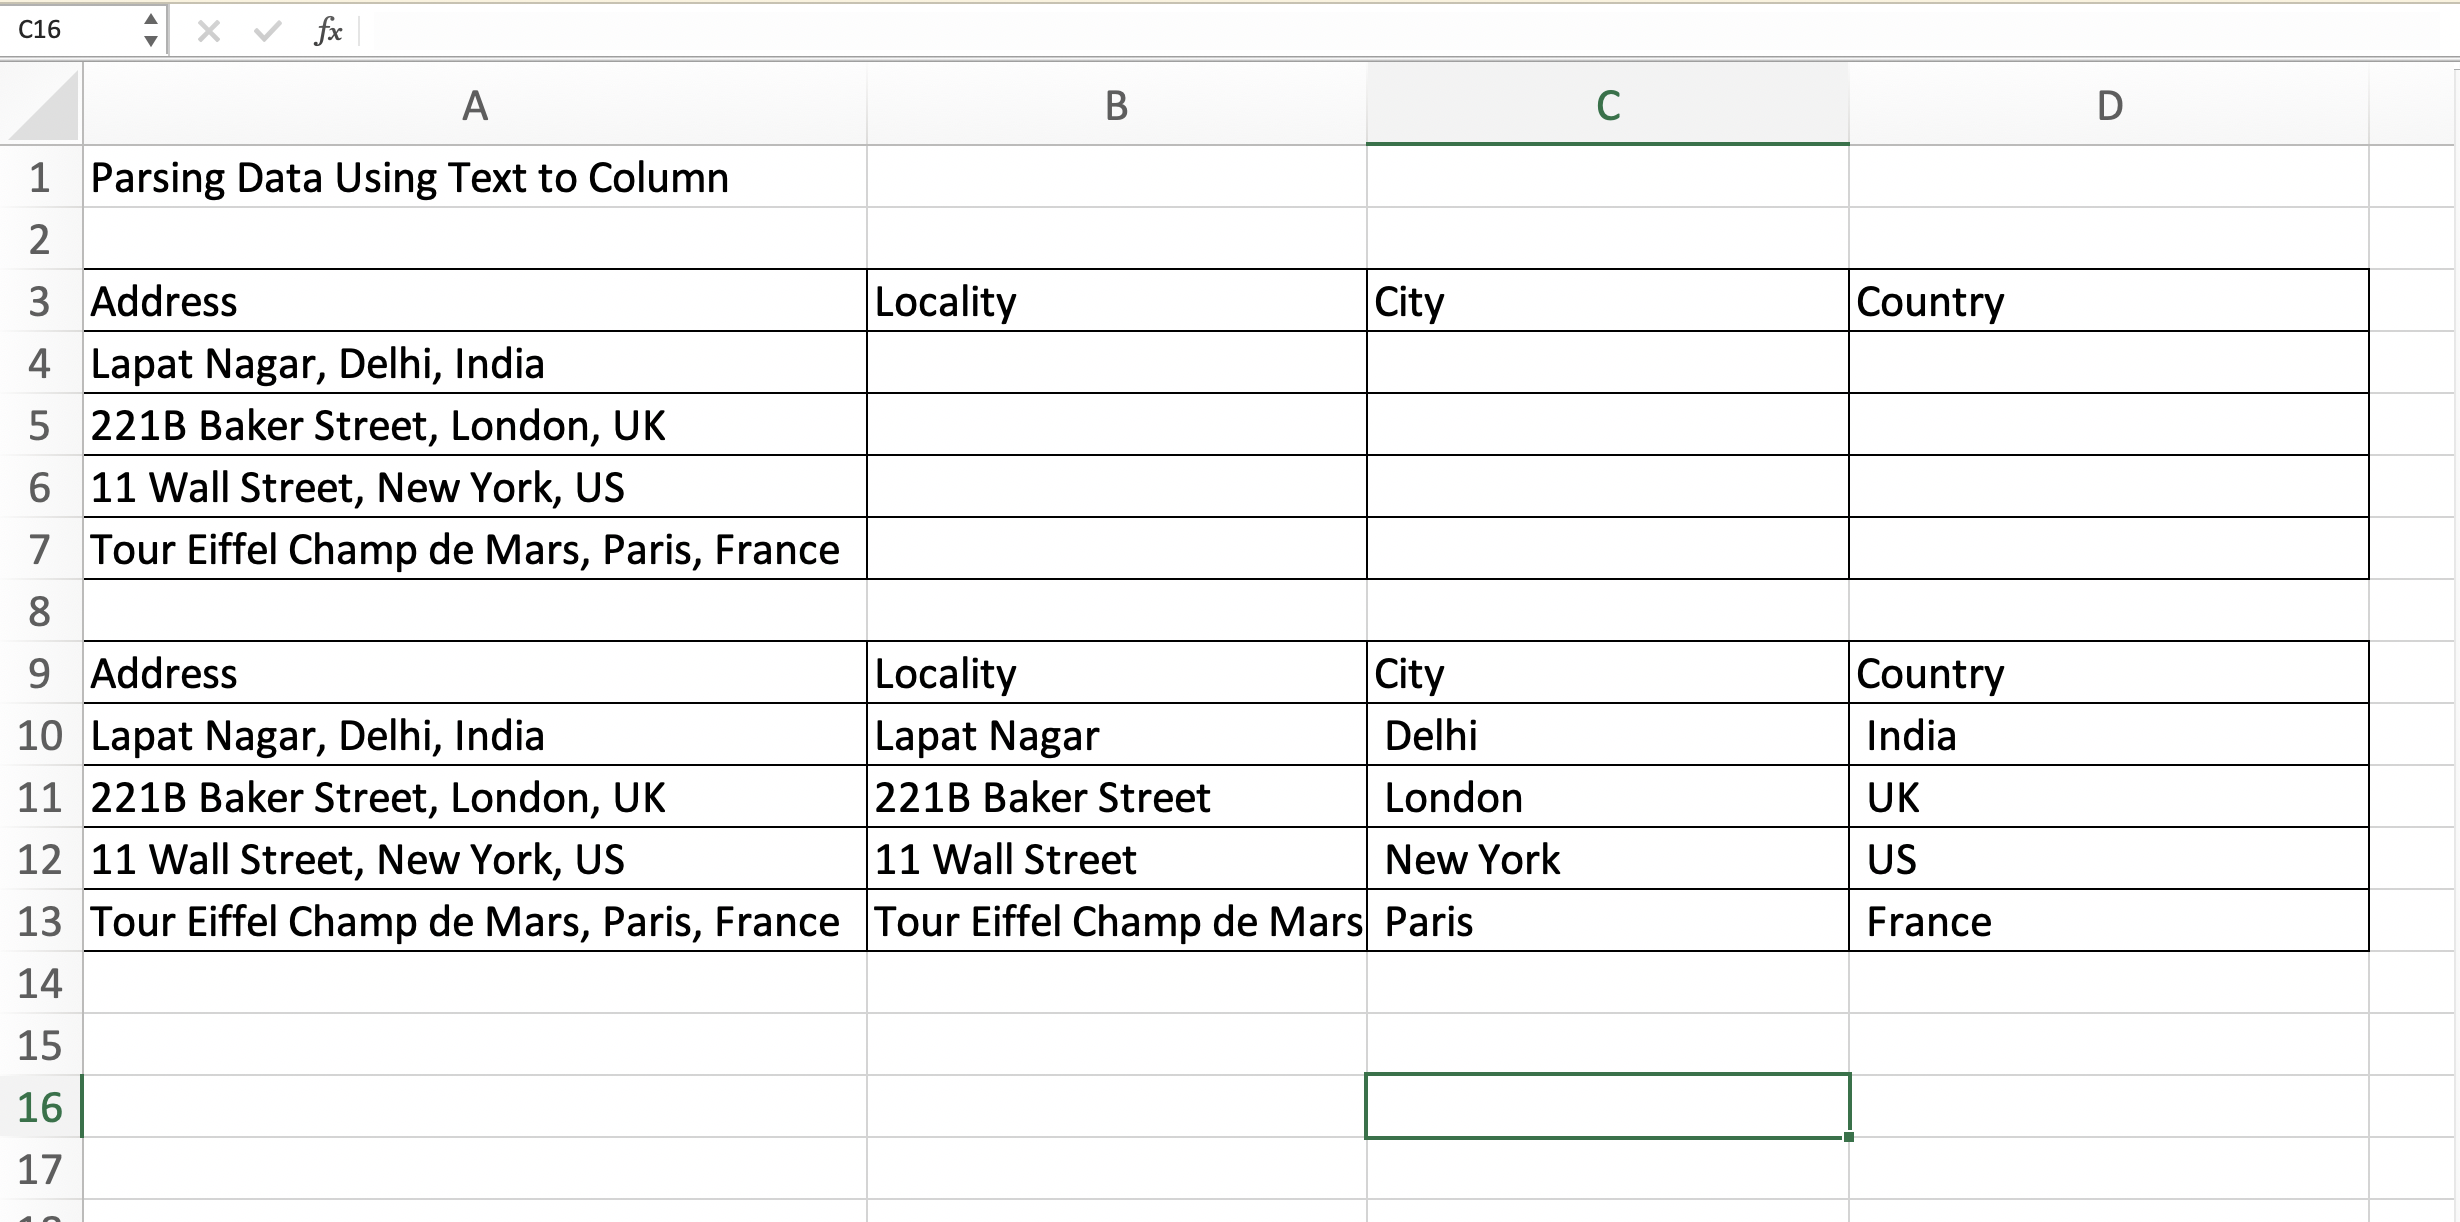
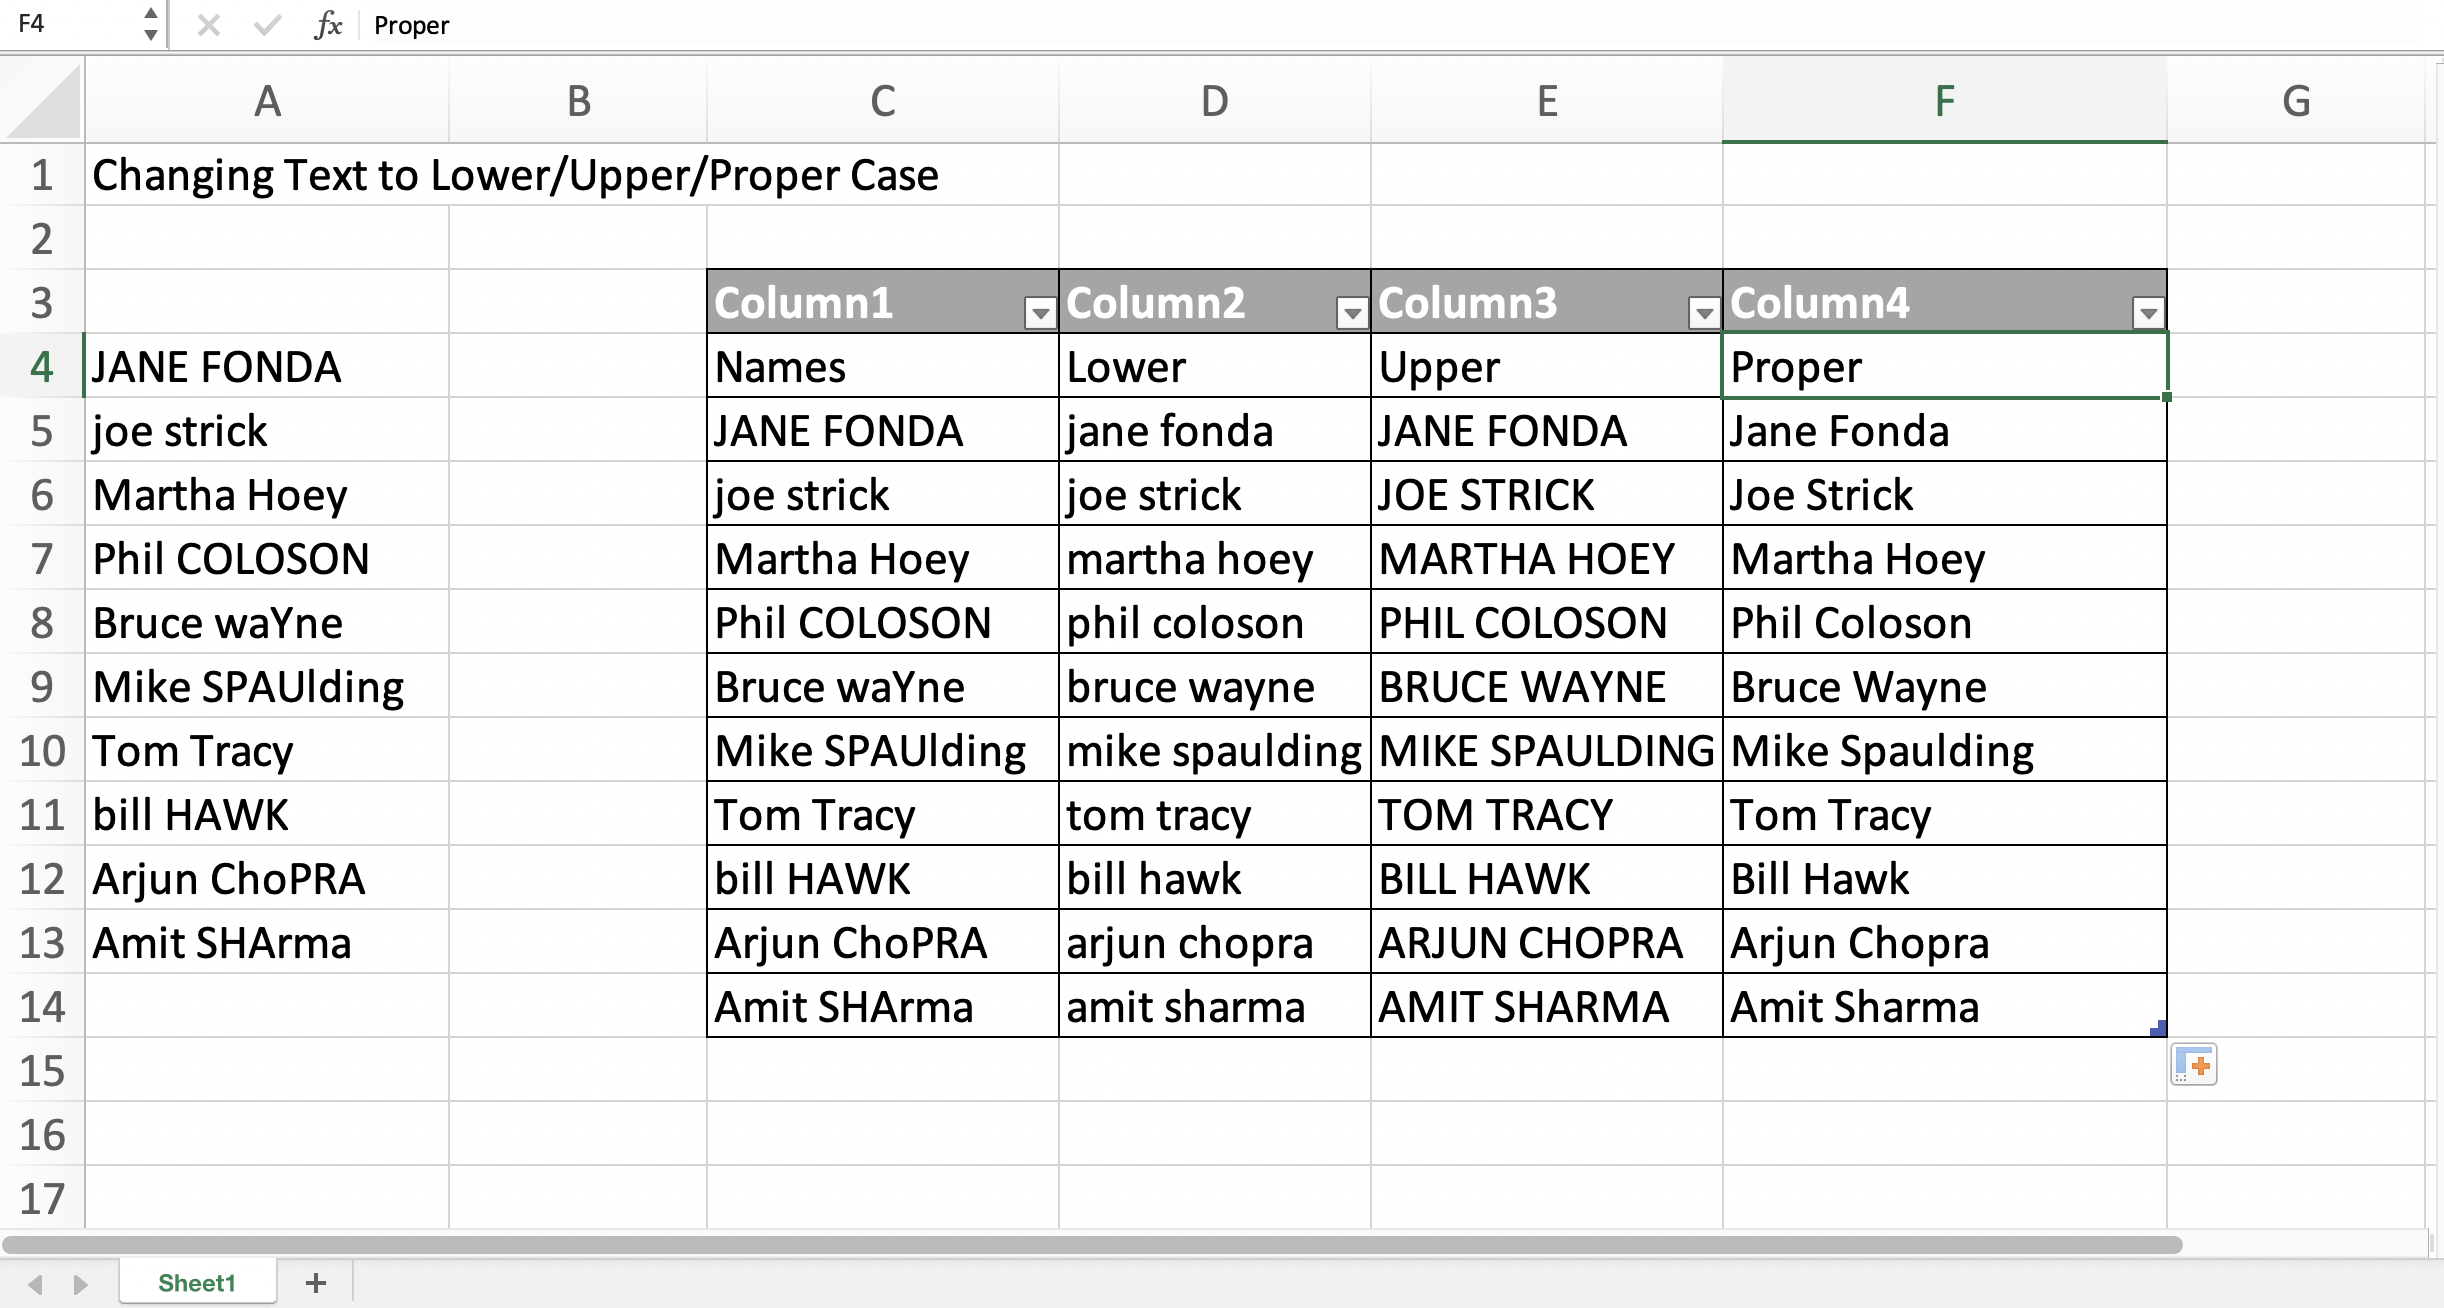
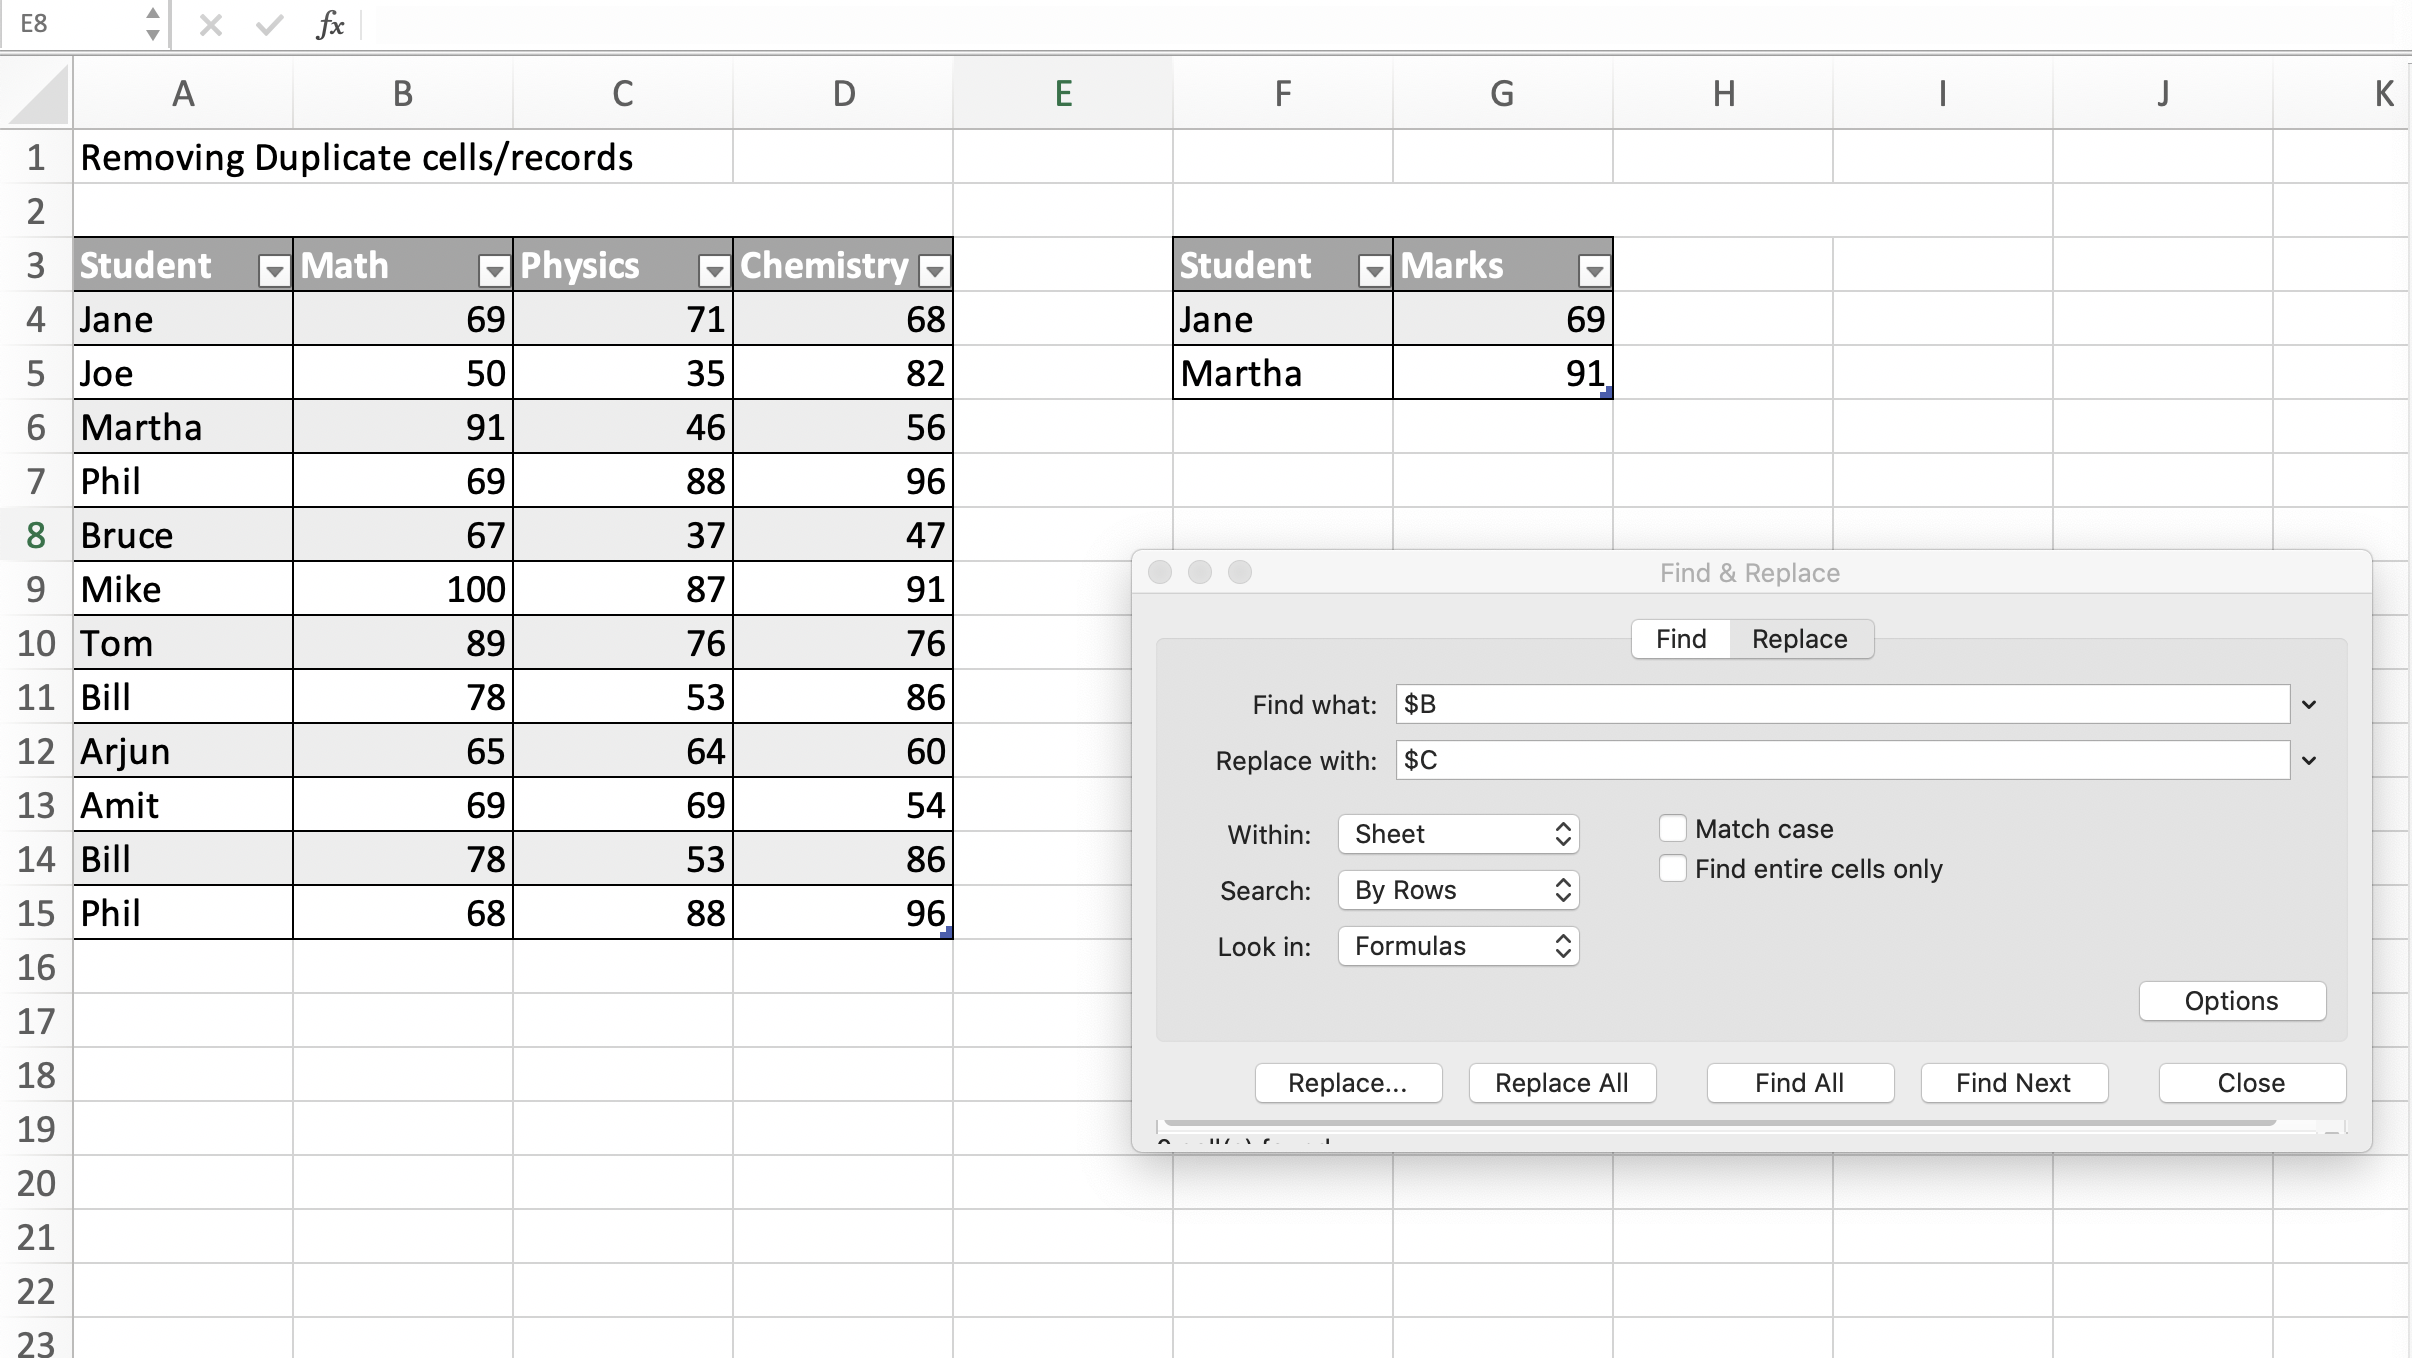
Cleaning up Data in Microsoft Excel